Voiland College Enrollment 2023
The bar graph and table below shows undergraduate and graduate enrollment from 2012 to 2023.
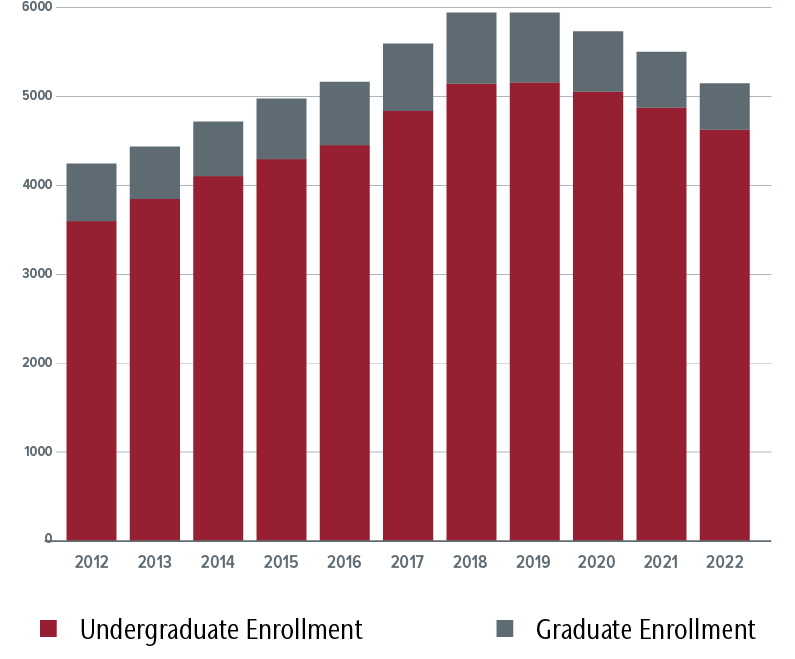
| Year | Undergraduate Enrollment | Graduate Enrollment |
|---|---|---|
| 2012 | 3,594 | 645 |
| 2013 | 3,840 | 592 |
| 2014 | 4,097 | 612 |
| 2015 | 4,289 | 681 |
| 2016 | 4,445 | 714 |
| 2017 | 4,833 | 755 |
| 2018 | 5,136 | 803 |
| 2019 | 5,152 | 787 |
| 2020 | 5,048 | 677 |
| 2021 | 4,867 | 628 |
| 2022 | 4,623 | 521 |
| 2023 | 3,261 | 300 |
| Total | 49,924 | 7,415 |
Note:
Starting in 2016, incoming students with math preparation below pre-calculus level are considered pre-engineering and are not counted in the college’s enrollment. For 2016, there were 146 students in pre-engineering.
Voiland College Degrees Conferred 2023
The bar graph and table below shows Bachelor’s, Master’s, and Doctoral degrees earned from 2014 to 2023.
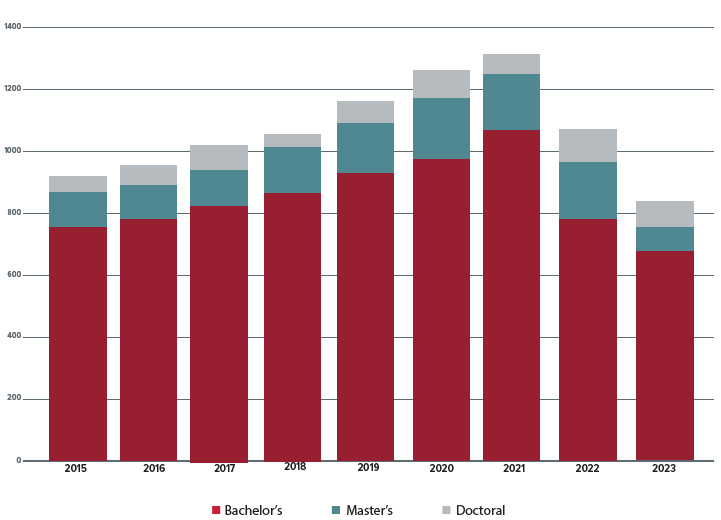
| Year | Bachelor | Master | Doctorate |
|---|---|---|---|
| 2014 | 653 | 126 | 41 |
| 2015 | 764 | 113 | 42 |
| 2016 | 776 | 147 | 52 |
| 2017 | 819 | 144 | 53 |
| 2018 | 858 | 146 | 35 |
| 2019 | 946 | 157 | 58 |
| 2020 | 981 | 200 | 72 |
| 2021 | 1070 | 169 | 51 |
| 2022 | 797 | 171 | 77 |
| 2023 | 658 | 112 | 63 |
| Total | 7,669 | 1,359 | 503 |
Voiland College Pullman Building Occupants By Head Count, 2023
This title chart and table below shows the type of personnel and the total head count as of Spring 2023.

| Personnel | Head Count |
|---|---|
| Graduate Assistants | 258 |
| Tenure Track Faculty | 143 |
| Staff | 114 |
| Non-tenure Track Instructional Faculty | 22 |
| Career Track | 52 |
| Total | 590 |
Total Voiland College Research Expenditures (USD)
This bar graph and table below shows the dollar amount (USD) of expenditures received during Fiscal Years 2012-2023. Fiscal Years 19-20 had no reported research funding due to the COVID-19 Pandemic.
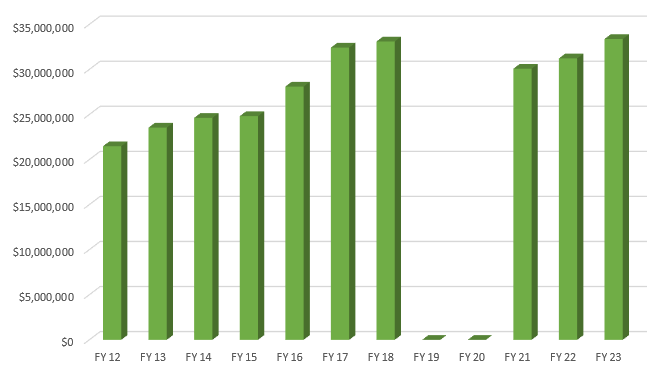
| Fiscal Year | Research Expenditures (USD) |
|---|---|
| 2012 | $21,482,245 |
| 2013 | $23,547,101 |
| 2014 | $24,627,949 |
| 2015 | $24,819,608 |
| 2016 | $28,104,289 |
| 2017 | $32,427,029 |
| 2018 | $33,110,146 |
| 2019 | $0 |
| 2020 | $0 |
| 2021 | $30,080,916 |
| 2022 | $31,227,580 |
| 2023 | $33,378,877 |
| Total | $282,805,740 |